It’s three days until the May 8th Republican “convention,” and we’re scraping the bottom of the barrel for content as everyone is sick of the mailers, texts, and false rumors.
But what has irked me more than any of those things are seeing posts like these:
 [1]
[1]
MY EYES!
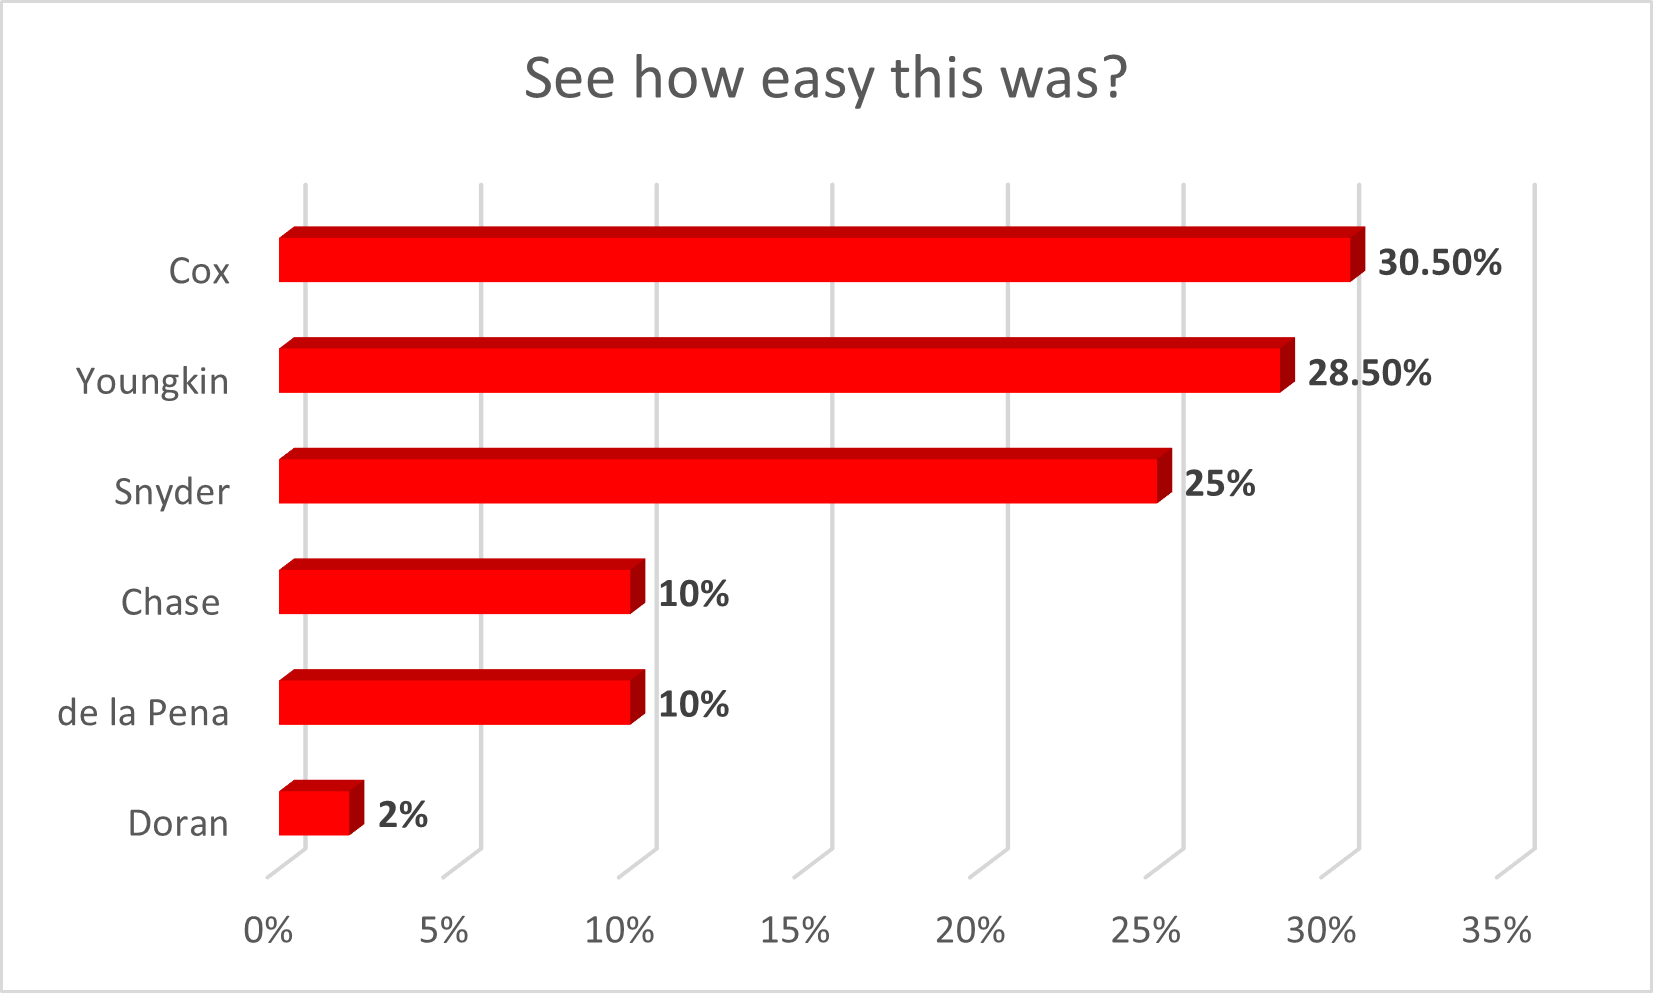
The proportions here are completely out of whack. The largest spacing gap is between 1st place and 2nd place, which is just a 2-point gap. Somehow, there’s just a tiny sliver between 2nd and 3rd, which is a 3.5-point game.
Then there’s a 15-point gap between 3rd and 4th, which is smaller than the 2-point gap between 1st and 2nd. Finally in 5th place is a 2% finish, which if you doubled his bar would be the same size as 30%.
Here’s how that chart should look:
 [2]
[2]
This isn’t to pick on the Giles County GOP; it’s not just them!
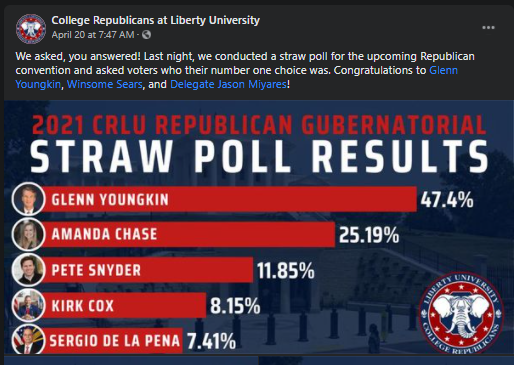
Behold from the College Republicans at Liberty University:
 [3]
[3]
Yes, the 22-point gap between 1st and 2nd is the same as the 13-point gap between 2nd and 3rd, and if you double the 3rd bar (to bring 11.85% to 23.7%), it would exceed the top bar of 47.4%.
Also, I’m still unclear on the decision to report to the hundredths decimal place, or why the first bar is only to the tenths.
Finally, there’s this one from the Faith & Freedom Coalition:
 [4]
[4]
This is a bit more subtle and less egregious than the other two, but the 3rd place bar (11%), if doubled, would be just barely behind the 2nd place bar at 39%. If you tripled the 3rd place bar (bringing 11% up to 33%), it would tower over the first two bars.
Also: one thing all three charts have in common is varying what decimal place they report to. Madness.
There will be a lot of discussions taking place due to the fallout of the May 8 vote and the process that brought us here. These discussions will happen at SCC, at the Unit level, and at auxiliary clubs across the Commonwealth.
I hope, at some point in those discussions, someone will take a few minutes and walk through how to create proportionally spaced charts.