If you haven’t been paying close attention to the redistricting court case in Virginia, now is a good time to start. Here is a brief catch-up.
In the 2011 redistricting, Republicans controlled the House of Delegates and the Governor’s Mansion with Gov. Bob McDonnell, while Democrats held the State Senate by a single seat. A compromise was reached: House Republicans would draw their own lines (favorable to Republicans), Senate Democrats would draw their own lines (favorable to Democrats, to try and maintain their majority), and the Congressional map would shore up and protect incumbents of both parties.
The Senate map faltered the next election in 2015, flipping to give Republicans a one-seat majority. The GOP House map held until November 2017, as lawmakers in 2011 didn’t foresee the collapse in the suburbs and revolt among women and college-educated voters that the party has gone through since 2016. The Congressional map held, too, with no party changes or even competitive races in Virginia until 2018, and the aforementioned suburban collapse.
I should say mostly held. In 2014, Democrats (led by Marc Elias and the National Democratic Redistricting Trust) filed suit against the Congressional lines, arguing the lines were drawn with race as a primary factor. That is, they alleged the map sought to pack black voters into Bobby Scott’s 3rd District, diluting their political power.
Judges ruled in the Democrats’ favor in October 2014, and went into effect after the Supreme Court refused to hear the case [1] in May 2016. The lines were redrawn in time for the 2016 election, resulting in the 4th District shifting from a GOP-leaning to a heavily Democratic district, which Don McEachin won and has held since.
Also in 2014, Democrats highlighted house of delegate districts they also felt packed minorities. This case was more circuitous: the District Court ruled against the Democrats [2] in October 2015, only to have the Supreme Court tell them [3] they had not used the right standards in March 2017.
Last June, a court panel ruled again [4], this time in favor of the Democrats and concluding that 11 Districts were racially gerrymandered. The Supreme Court will take up this case this Spring, and could still overturn the district court decision. That would keep the current map for 2019, and make this entire analysis moot.
However, the Supreme Court earlier (and not unexpectedly) declined to stay [5] the redistricting process before they ruled on the decision, allowing the state to move forward with drawing new lines. If affirmed by SCOTUS, the new maps will go into effect in time for the 2019 elections.
The District Court first allowed the legislature to redraw the lines, which Republicans eagerly did. But with the near certainty that the court-drawn lines would be more favorable to Democrats than any bi-partisan-approved map, Gov. Ralph Northam announced he would veto [6] the plan drawn by House Republicans. The Court then turned to Bernard Grofman to act as Special Master [7] and propose new maps for the Court’s consideration, alongside maps submitted by House Republicans and the NAACP.
On December 7 last year, Grofman released his report [8] and proposed lines. First, he started with the 11 districts deemed unconstitutional. Those are:
HD-63 (Aird)
HD-69 (Carr)
HD-70 (McQuinn)
HD-71 (Bourne)
HD-74 (Bagby)
HD-77 (Hayes)
HD-80 (James)
HD-89 (Jones)
HD-90 (Lindsey)
HD-92 (Ward)
HD-95 (Price)
Obviously, any changes to those districts will impact the lines of neighboring districts. In order to have the maps be as narrowly tailored as possible — that is, impact the fewest number of districts — Grofman only included for changes those districts which were adjacent to one of these 11 and also covered part of the same county. However, even then not all considered districts needed changes. Ultimately, Grofman proposed several plans with changes to a range of districts, from 21 to 26. (The court ultimately settled on 25.)
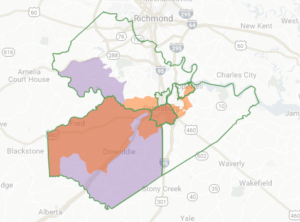
In order to make things easier for the court, Grofman was able to separate out these 11 districts (and their neighboring adjustments) to four “modules” that are mutually exclusive. Those were based on regions: HDs 69, 70, 71, and 74 in Richmond/Henrico; HD-63 in Petersburg; HDs 77, 80, 89, and 90 in Norfolk-Chesapeake-Portsmouth, and HDs 92 and 95 in the Peninsula.
For each module, Grofman offered 2-3 map options, with factors like compactness and narrowness of the changes accounting for the differences.
It’s worth noting that, while not a primary factor, Grofman did not wish to draw maps that would pit two incumbents against one another, and none of his maps do so.
In a court ruling last evening [9], the court announced their decision on which module variations they would accept:
Here's a screenshot of the order in the VA racial gerrymandering case, for anyone who's interested pic.twitter.com/uad4oa4oeq [10]
— Ben Williams (@DrawFairLines) January 23, 2019 [11]
That’s Petersburg 2, Peninsula 2, Richmond 1A, and Norfolk 1A. Helpfully, VPAP has already converted all the proposed plans into maps [12], so plug in those four options and you’ll have your new maps.
Below are the district-by-district changes, using the four-region approach. According to the report, “For studying the realistic opportunity of an African-American candidate of choice to win elections,” Grofman used the 2012 Presidential election results at the precinct-level as a baseline. While a bit outdated, this does allow direct analysis. I’ve also noted the old Northam ’17 and Kaine ’18 numbers for each of the districts.
Also included for each district is a map, courtesy of VPAP [13]. Note that the purple represents the new district and the light orange represents the old. The darker portions are where the two overlap. The link above allows you to toggle on/off the map overlays for each district.
*indicates it is one of the 11 districts found unconstitutional
Richmond/Henrico Districts (5)
 HD-69*
Incumbent: Betsy Carr (D)
2012 Obama: 86%
2017 Northam: 86%
2018 Kaine: 88%
New Obama: 86% (-)
Carr’s district barely changes. Note: in the December 2018 report from the Special Master, Grofman inverts the new Obama vote % for HD-69 and HD-70 in the table showing the changes in plan 1A. VPAP, and this data, is correct.
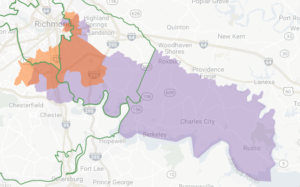
HD-70*
Incumbent: Delores McQuinn (D)
2012 Obama: 80%
2017 Northam: 80%
2018 Kaine: 82%
New Obama: 72% (-8%)
McQuinn’s grabs Charles City County away from HD-74, making her district less Democratic by a handful of points. Still heavily Democratic.
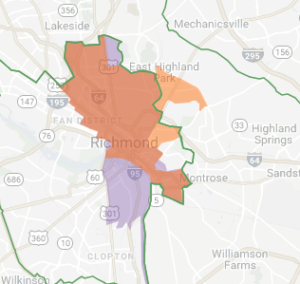
HD-71*
Incumbent: Jeff Bourne (D)
2012 Obama: 87%
2017 Northam: 88%
2018 Kaine: 90%
New Obama: 87% (-)
Bourne’s new district crosses the James, but doesn’t shift vote-wise.
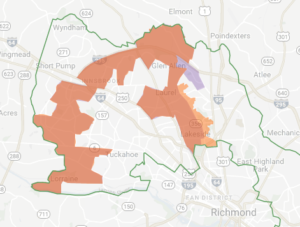
HD-72
Incumbent: Schuyler VanValkenburg (D)
2012 Obama: 44%
2017 Northam: 53%
2018 Kaine: 58%
New Obama: 46% (+2%)
The court passed on the chance to make the 72nd and the 73rd more compact; instead, it made no changes to the 73rd and left the 72nd largely intact. This district could be competitive in November, though Henrico (like other suburbs) have shifted towards Democrats since when Romney carried this district.
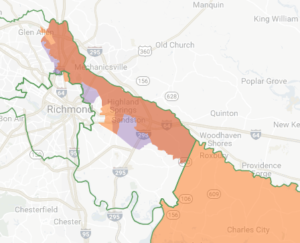
HD-74
Incumbent: Lamont Bagby (D)
2012 Obama: 75%
2017 Northam: 75%
2018 Kaine: 77%
New Obama: 74% (-1%)
The 74th gives up Charles City County to the unpacked 70th district, but the new precincts it takes on from Henrico don’t shift it much politically.
SUMMARY:
The biggest change here is unpacking the 70th and extending it east into Charles City County, a 7-point shift. However, the biggest impact is on the 72nd, where even a 2-point shift turns this into a 55% Northam district and making VanValkenburg’s re-election (and Democrats’ chances) just a little easier. The rest of the districts are adjusted slightly but don’t move politically. The court was offered, but declined, the chance to make HD72 and HD73 more compact, instead opting to keep the changes as narrowly tailored as possible.
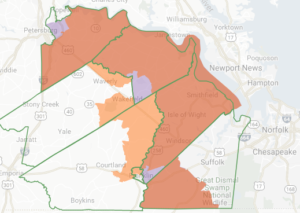
Petersburg Districts (5)

HD-62
Incumbent: Riley Ingram (R)
2012 Obama: 47%
2017 Northam: 49%
2018 Kaine: 53%
New Obama: 47% (-)
The district loses its entire Henrico spur, and also puts Hopewell City inside one district instead of two. Despite this, the vote share hardly shifts. Of note: Ingram has already announced he’s not running for re-election.
HD-63*
Incumbent: Lashrecse Aird (D)
2012 Obama: 72%
2017 Northam: 67%
2018 Kaine: 69%
New Obama: 59% (-13%)
This map loses its half of Hopewell, as well as its Prince George corridor, and instead takes over all of Dinwiddie (to go with all of Petersburg City). The result is a district 13-points more Republican, putting it on the fringes of contention.
HD-64
Incumbent: Emily Brewer (R)
2012 Obama: 42%
2017 Northam: 40%
2018 Kaine: 41%
New Obama: 43% (+1%)
The changes here mostly keep the district more contained countywise. It loses its claim to Franklin City, Southhampton, and Sussex; in exchange, it now covers all of Isle of Wight and Surry (and almost all of Prince George). It should remain safe Republican.

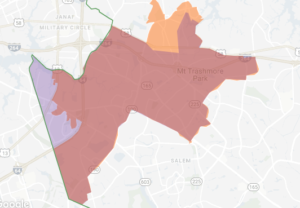
HD-66
Incumbent: Kirk Cox (R)
2012 Obama: 37%
2017 Northam: 39%
2018 Kaine: 43%
New Obama: 53% (+16%)
This is the biggest change of any of the impacted districts, with the Speaker’s district going from safe Republican to a 55% Northam district. By losing its east-west construction and going north-south instead, it picks up the deep blue parts of the county (and the two blue precincts in the south as well) while losing the red parts out west. Use this 2017 precinct map [14] as a comparison to see exactly how this new construction hoses Cox but good. This will be very competitive in the fall if it stands.
HD-75
Incumbent: Roslyn Tyler (D)
2012 Obama: 63%
2017 Northam: 56%
2018 Kaine: 58%
New Obama: 60% (-3%)
Completing the county compactness from HD 63 & 64 above, this swaps out its portions of Dinwiddie, Surry, and Isle of Wight, and gains complete coverage over Southampton and Sussex instead. These changes make it a roughly 53% Northam district.
SUMMARY:
Obviously the headline here is what this does to Speaker Cox’s district, essentially creating a new vulnerable Republican seat wholesale. Ingram’s district doesn’t shift much, but was expected to be competitive regardless. The other districts get more competitive, to the fringes of contention for either side. The unpacking of HD-63 (the only district here considered unconstitutional) means moving out of Hopewell and down into Dinwiddie, and the court prioritized county compactness across the rest of the neighboring districts.
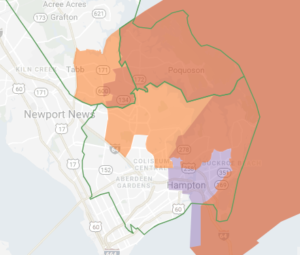
Peninsula Districts (5)
HD-91
Incumbent: Gordon Helsel (R)
2012 Obama: 44%
2017 Northam: 47%
2018 Kaine: 50%
New Obama: 54% (+10%)
Losing a couple of red-leaning York precincts for some deeper-blue Hampton precincts shifts this district ten points more blue, making this a 57% Northam district. Helsel won re-election 56%-43% last time around, so the race will be competitive for each side.
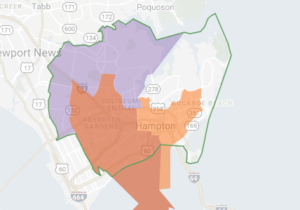
HD-92*
Incumbent: Jeion Ward (D)
2012 Obama: 80%
2017 Northam: 80%
2018 Kaine: 81%
New Obama: 76% (-3%)
One of two unconstitutional districts on the Peninsula, this shifts the district from Central Hampton to Northern Hampton, but still remains safely Democratic.

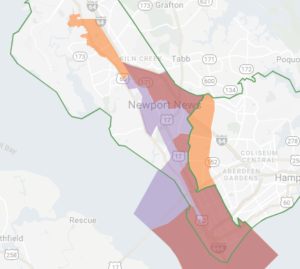
HD-93
Incumbent: Mike Mullin (D)
2012 Obama: 58%
2017 Northam: 61%
2018 Kaine: 63%
New Obama: 52% (-6%)
By grabbing a few more York precincts and losing a few Newport News precincts, this district becomes about 6 points more Republican and making it possibly competitive in November.
HD-94
Incumbent: David Yancey (R)
2012 Obama: 52%
2017 Northam: 55%
2018 Kaine: 59%
New Obama: 59% (+7%)
This race famously ended in a tie in 2017. Now 7-points more blue, it becomes one of the top targets for Democrats.
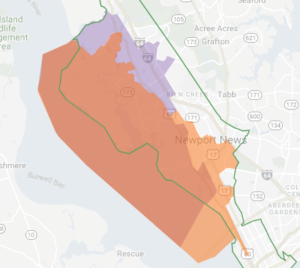
HD-95*
Incumbent: Cia Price (D)
2012 Obama: 79%
2017 Northam: 77%
2018 Kaine: 79%
New Obama: 72% (-7%)
The second of the two unconstitutional districts, this one loses its entire Hampton contingent, and instead picks up some slightly redder precincts in Newport News. Emphasis on “slightly” — this is still a safe Democratic district.
SUMMARY:
Beyond the two districts deemed unconstitutional, these changes effect three other seats: one Democrat and two Republicans. The changes here have the effect of making each of those three more competitive. However, the different is more pronounced for Helsel and Yancey, the latter of whom was in as tight a race as possible last time out. As a result, there is a net benefit to Democrats here.
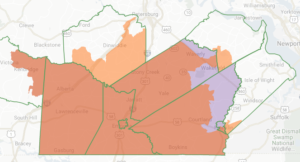
Southside Hampton Roads (10)

HD-76
Incumbent: Chris Jones (R)
2012 Obama: 44%
2017 Northam: 50%
2018 Kaine: 51%
New Obama: 58% (+14%)
The district sheds its Chesapeake precincts and becomes all-Suffolk, making it 14-points more blue and rivaling the Speaker for the biggest change. Now a 60%+ Northam district, this becomes a top pick-up opportunity for Democrats in November.
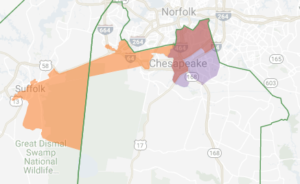
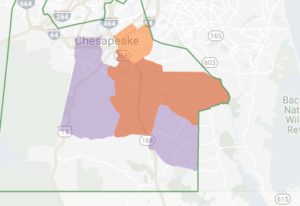
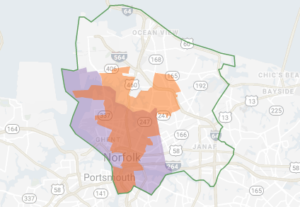
HD-77*
Incumbent: Cliff Hayes (D)
2012 Obama: 78%
2017 Northam: 77%
2018 Kaine: 78%
New Obama: 64% (-14%)
The first of three districts found unconstitutional, this lops off the jut out to the blue parts of Suffolk and instead contains the district to South Norfolk and the Greenbriar/Battlefield part of Chesapeake. While the 14-point shift is similar to Chris Jones’s in the 76th, the district began so blue that it will likely remain uncompetitive.
HD-78
Incumbent: Jay Leftwich (R)
2012 Obama: 39%
2017 Northam: 44%
2018 Kaine: 46%
New Obama: 36% (-3%)
There aren’t dramatic changes to this district, and the net effect is making the seat a safer Republican district.

HD-79
Incumbent: Steve Heretick (D)
2012 Obama: 62%
2017 Northam: 65%
2018 Kaine: 67%
New Obama: 59% (-3%)
The new map actually makes Heretick’s district less compact and picks up part of Suffolk. Weird. Anyways, it’s not enough to make this district competitive.

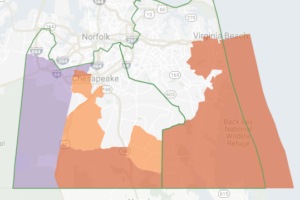
HD-80*
Incumbent: Matthew James (D)
2012 Obama: 75%
2017 Northam: 75%
2018 Kaine: 77%
New Obama: 71% (-4%)
This district loses its Norfolk and Suffolk parts to be all Portsmouth, and in doing so shifts Republican by 4-points. Not enough to be competitive, though.
HD-81
Incumbent: Barry Knight (R)
2012 Obama: 42%
2017 Northam: 41%
2018 Kaine: 45%
New Obama: 50% (+8%)
Knight won 59%-41% in 2017, so he can probably shoulder this shift. Still, the district is now closer to 50/50 and will be competitive in the fall.
HD-83
Incumbent: Chris Stolle (R)
2012 Obama: 47%
2017 Northam: 50%
2018 Kaine: 52%
New Obama: 53% (+6%)
The district loses (almost) all of its Norfolk parts and becomes (almost) all Virginia Beach. Stolle won 57%-43% in 2017, so much like Barry Knight, this race promises to be closer but Stolle is still the favorite for re-election.
HD-85
Incumbent: Cheryl Turpin (D)
2012 Obama: 50%
2017 Northam: 53%
2018 Kaine: 56%
New Obama: 51% (+1%)
Turpin won by fewer than 400 votes in 2017. The district shift is small, and worth about a single point, which means it still be competitive in the fall.
HD-89
Incumbent: Jay Jones (D)
2012 Obama: 82%
2017 Northam: 82%
2018 Kaine: 83%
New Obama: 83% (+1%)
The district shifts a little bit to the south and remains overwhelmingly Democratic.
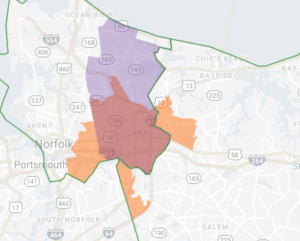
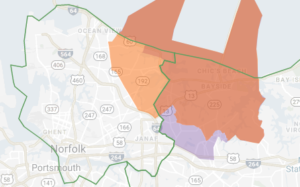
HD-90*
Incumbent: Joe Lindsey (D)
2012 Obama: 80%
2017 Northam: 80%
2018 Kaine: 80%
New Obama: 70% (-10%)
The district becomes more compact and stays entirely within eastern Norfolk. As a result, it drops 10 points more Republican, but still will remain safely Democratic.
SUMMARY:
The big impact here is essentially turning Chris Jones’s district blue. Knight and Stolle in HD-81 and HD-83 will have harder re-election battles than previous years, but both should be favored. Turpin is shored up slightly in HD-85, but not enough to effect the competitiveness of the race. The changes here also continue the pattern of keeping the districts more compact and limiting cross-jurisdictional lines, with the one weird exception of HD-79.
Biggest Shifts to Competitive Districts:
HD-66 (Cox) – D+16
HD-76 (Jones) – D+14
HD-91 (Helsel) – D+10
HD-81 (Knight) – D+8
HD-94 (Yancey) – D+7
HD-83 (Stolle) – D+6
HD-93 (Mullin) – R+6
Overview:
Putting aside the legal reasoning behind the line changes and looking at the electoral impact, this has a clear advantage for Democrats. As the list above attests to, almost all the negative shifts in competitive districts are currently held by Republicans. Of course, there are equal, counterweight shifts just as big that impacts Democratic districts, but those are so overwhelmingly blue that they will remain uncompetitive.
In the meantime, this shift, if approved, puts HD-66 (Cox) and HD-76 (Jones) on the map in a big way, while making life much harder in HD-94 (Yancey). Incumbents in HD-81 (Knight), HD-83 (Stolle), and HD-91 (Yelsel) are still initially favored, but will have work to do. The sole Democrat impacted, Mike Mullin, is in a similar position. Meanwhile, three more districts barely shifted at all but remain competitive. These are the open HD-62 (Ingram), HD-72 (VanValkenburg), and HD-85 (Turpin).
As a reminder, these changes could all be scuttled (and this analysis worthless) if the Supreme Court overturns the District Court’s decision. The decision not to stay the process is not a reliable indicator; however, the Court’s previous ruling on Virginia’s Congressional maps could be.
Thanks to VPAP [15] for use of the redistricting maps.