NYTimes-Siena VA-02: Taylor +8 (or, How to Look At Polls When They Disagree)

In my polling roundup last week, I specifically highlighted the polling work that the New York Times is doing with Siena College, and also featured an internal poll from the Elaine Luria campaign, the first poll we’ve seen from the second district this cycle.
That poll showed Luria leading the incumbent by eight points, 51 percent and 43 percent. I wrote the following:
How much should we credit this internal? Well, it’s methodology is clearly stated, it is a live-caller poll with cell phones, and it was conducted by a respected Democratic firm. There are no public polls released here, and the analysis is biased, but not misleading. In my opinion, the onus is on those who discredit the survey to show a different result.
Shortly after that post went up, the Times started calling in the 2nd District (I take full credit), and wrapped up the poll on Monday:
NYTimes-Siena
Live-caller with cell phones
n=500
Taylor (R) 49%
Luria (D) 41%
Quite a different result — instead of trailing by eight, Taylor is up by eight. I wrote of the reasons to be skeptical (or not) of released internal polls, but one of the major reasons is if it goes against what public polls show. Now it does.
Thanks to the Luria campaign releasing a detailed polling memo, and the NY Times transparency with their polling experiment, we can compare other topline numbers as well.
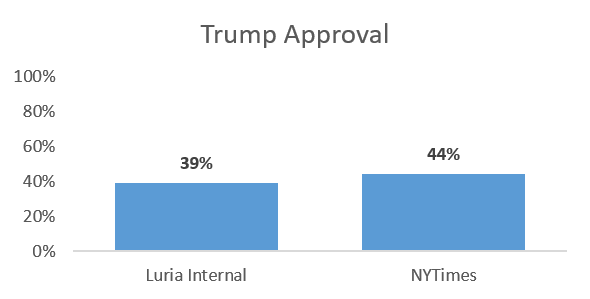
Trump Approval
In Luria’s poll, Trump has a 39 percent approval rating in the 2nd District. In the NYTimes, he has a 44 percent approval rating. Not much difference.
 The NYTimes asks other questions as well. The district’s preference is to see Republicans control the House, by a 49%-42% margin (this is one way to ask the generic ballot). However, they also want to see their Congressman be a check on the President’s agenda, by a 48 %-42% margin.
Luria Image
In Luria’s poll, she has a 34%-to-8% favorable-to-unfavorable rating; that’s a hard name ID of 42% (hard name ID refers to voters who know enough to form an opinion about a candidate). In the NYTimes’ poll, she has a 36%-to-31% favorable-to-unfavorable rating.
 Whoa! That’s a big difference — a full 23 percent points higher negatives and a hard name ID of 67 percent instead of 42 percent. What could account for this?
Here’s my theory: question order. Designing a survey is tricky, because every question that is asked is influenced by the questions that came first. For that reason, you want to ask first the questions for which you want the most clear read.
Public polls conducted for media release focus on the horse race numbers. In order to get the most unadulterated result for the ballot test, they typically ask that as the first question of the survey. (Neither the NYTimes nor the Luria poll released the full survey instrument with question order.)
Also, ballot tests in surveys try to adhere as closely to the ballot as possible. On your ballot in November, beside each of the candidate names will be the party they represent. So the ballot test might ask, “Do you plan to vote for Scott Taylor, the Republican, or Elaine Luria, the Democrat?”
Then later on, when they ask how voters feel about each candidate, they answer that question with the knowledge that, 1) the name they heard is running for office, and 2) which political party they belong to. Partisans fall in line.
Internal polls — if they’re to be used for strategic purposes — often ask candidate images first. This avoids influencing the candidate image with partisanship, which gives the cleanest read of their name ID to the campaign. (The impact of asking candidate images first before the ballot test is considered to be low.)
If Luria’s poll was used for strategy, and they asked candidate images first before she is identified as a Democrat, that would explain the huge jump in unfavorables and the difference in the results.
Taylor Image
As an incumbent, Taylor’s name ID should be higher and it is. In Luria’s poll, he has a 33%-33% fav-unfav, whereas in the NYTimes’ poll he has a 51%-33% fav-unfav. (According to Luria’s poll, Taylor’s image was 41%-27% back in June).
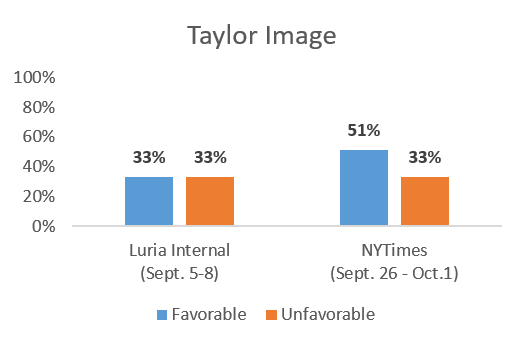 That’s quite a big difference as well between the two polls. In fact, it’s almost not surprising that Luria was leading a poll where no one views her unfavorably and the incumbent has only a 33% favorable rating. Why is her campaign poll so different from the NYTimes?
One possible reason is timing. The Luria internal was conducted from September 5 – 8. The NY Times poll was conducted from September 26 – October 1. That’s over half a month of time in between, at a time when some voters are first tuning in, news is constantly changing, and political advertisements are running wild. That alone could possibly explain the discrepancy.
But there’s another possible explanation: the petition story involving Scott Taylor’s campaign broke in the Virginian Pilot on August 24th. A cursory Google search shows at least a half-dozen stories on the issue between the 24th and September 5th, when the Luria poll started, including the headline that Taylor was subpoenaed on September 4th. The story was both recent and more than just a one-day story.
In fact, the polling memo from Luria’s campaign explicitly mentioned the issue as a reason why Taylor’s negatives were so low. It’s possible that, with the issue in the rearview mirror, Taylor’s image recovered and his ballot positioned strengthened.
Unskewed?
Every survey of likely voters involves an attempt to guess who is actually going to vote in 2018. There’s two main ways pollsters do this: first, through a likely voter screen; second, through a sample frame and weighting so that the demographics of the poll match the demographics of the electorate. The problem, of course, is that no one can possibly know who’s going to vote in 2018 until they vote. That’s why adhering to tried-and-true methodologies is so important.
Attempting to identify and diagnose sampling error can easily lead down the rabbit hole of “unskewing,” along the lines of the ill-fated effort among conservatives to convince themselves Mitt Romney was headed towards an Electoral College landslide in 2012.
It’s important to note that differences in sampling or in determining likely voters does not necessarily mean either poll is inaccurate. You may have a preference from one poll or the other (it will likely coincide with which one shows your preferred candidate winning), but always tread carefully when attacking opposing polls you disagree with.
I’m not going to attempt to “unskew” either poll, plus the Luria internal doesn’t provide a party breakdown of respondents anyways. But if your first instinct when you see a poll you don’t like is “they must’ve sampled too many from [the other political party],” get a new instinct.
Outliers and Margins of Error
Set aside sampling differences and the two weeks between field dates. Because both polls were conducted scientifically and with similar methodology, it’s possible that one or the other (or both) are outliers. First, refer back to my previous post about margins of error. In Luria’s poll, she could be as low as 46 percent or as high as 56 percent; in the NYTimes poll, she could be as high as 46 percent or as low as 36 percent.
If the final result on Election Day is a narrow 49%-48% outcome (regardless of winner), it’s difficult to say that either poll, over a month away, was “wrong.”
Outliers are not just acceptable; they are good. This is especially so in races where there is a lot of public polling (like states during a presidential year). Oftentimes, unscientific polls like robo-polling and online polls weight their results to ensure they align with the conventional wisdom. This is a cover-your-ass move to prevent embarrassment or loss of credibility, and it’s a concept known as “herding.”
The polls most likely to break from the pack and stand, proudly, as an outlier are the polls conducted by the most reliable outfits, who used a consistent and sound scientific methodology, and rely on their process to validate their credibility, not their outcome.
I said it last post and I’ll say it again here, and I might find a way to repeat it in every post I ever do: Polls are not predictions. Not only are they snapshots in time, but they offer a range of potential outcomes, both due to the margin of error and also due to unallocated voters (those who show up as “undecided,” or those who don’t pass a voter screen but vote anyways).
To read a poll accurately, you must factor in these ranges of outcomes and the uncertainty it implies. Many political observers and pundits and even pollsters are in a rush to “know,” and they ascribe a false certainty to polls when they’re released. This instinct compounds upon itself, to the point that some polling analyses just look at the head-to-head numbers, cement an opinion, and move on in a matter of seconds. It’s a misguided understanding of the polling industry, and it is the primary culprit for why people perceive polls as having been wrong in 2016 (when they really weren’t).
Rant over.
Summary
This is a far more in-depth post than would normally be warranted for the release of one poll; but, since I covered the Luria internal, I felt it important to discuss both this new poll and also explore the differences between them.
A shorter post could accurately leave it at the fact that Taylor is in a strong position as of late September, and has seemingly recovered from whatever damage the petition issue may have caused. There’s a lot of time left before November so neither Taylor nor the NRCC should breathe easily when it comes to the 2nd District. However, the race should be considered “Lean Republican Hold” at the moment.
